This is an old revision of the document!
Add
pl2 = Graphics.Add(pl, Element1, Element2, …, Options) returns a copy of the Graphics object pl with lines, curves, arcs, texts, bitmaps or other Graphics objects added to it; pl itself stays as it is. pl.Add(Element1, Element2, …, Options) adds them to pl itself and returns nothing.
A point is given as {x, y}, a fraction of the width and of the height of the page: (0,0) is the lower left and (1,1) the upper right corner. Widths of lines, radii and the height of texts are fractions of $\sqrt{\mathrm{width} \cdot \mathrm{height}}$ of the page, so that a circle stays round on a page of any shape.
Input
-
pl : a Graphics object, for example made by Graphics.New() or Graphics.Plot().
-
Element1, Element2, … : one or more elements, each one of
-
a line, a list of points { {x1, y1}, {x2, y2}, …}, joined by straight pieces.
-
a curve, a list of points { {xL1, yL1, x1, y1, xR1, yR1}, {xL2, yL2, x2, y2, xR2, yR2}, …}, joined by cubic Bezier pieces. Each point $(x, y)$ comes with two control points: $(x_L, y_L)$ for the piece that ends at the point and $(x_R, y_R)$ for the piece that starts at it. The piece from point $n$ to point $n+1$ starts in the direction of $(x_{R,n}, y_{R,n})$ and arrives from the direction of $(x_{L,n+1}, y_{L,n+1})$; a control point on the point itself gives a sharp corner.
-
an arc, {“Arc”, {x, y}, R} for a circle with centre {x, y} and radius R, or {“Arc”, {x, y}, R, Theta1, Theta2} for the part from the angle Theta1 to Theta2, counterclockwise. The angles are in radians, measured from the horizontal axis and taken modulo $2\pi$; when Theta2 is smaller than Theta1 the arc runs through 0, so {“Arc”, {x, y}, R, 3*Pi/2, Pi/2} is the right half of a circle.
-
a text, given as three elements: the string, x and y, for example pl.Add(“text”, 0.5, 0.9). The point is the left end (or the middle or the right end, see “Alignment”) of the line the letters stand on.
-
a bitmap, {“BitMap”, {x1, y1}, {x2, y2}, Pixels}, with {x1, y1} the lower left and {x2, y2} the upper right corner of the rectangle it fills. Pixels is a list of rows, the first row at the top, each a list of pixels. A pixel is a number (grey), {grey}, {r, g, b} or {r, g, b, t}, each from 0 to 255 (values outside are clipped), with t the transparency, 0 opaque and 255 fully transparent.
-
a bitmap with a transparent color, {“BitMap”, {x1, y1}, {x2, y2}, Pixels, TransparentColor}. The pixels with the red, green and blue of TransparentColor, given as a pixel, become fully transparent, or get the transparency t of TransparentColor when it is given as {r, g, b, t}.
-
a bitmap made by a function, {“BitMap”, {x1, y1}, {x2, y2}, ColorFunction, M1, M2, …}, with M1, M2, … matrices of the same size (Lua tables or Matrix objects). The pixel in row $i$ and column $j$, row 1 at the top, gets the color r, g, b = ColorFunction(Re M1[i][j], Im M1[i][j], Re M2[i][j], Im M2[i][j], …), each from 0 to 1 (values outside are clipped).
-
a BitMap object.
-
a Graphics object. A copy of it is added as a layer, on top of what is on pl; changing it afterwards does not change pl. A layer keeps its own size and position on the page, in mm (see the page).
Options : (optional) A table of options. They apply to all elements of the call. Possible options are:-
“Color” : 32 bit integer 0xAARRGGBB, the color of lines, curves, arcs and texts. Default value 0x000000 (opaque black)
-
“Transparancy” : Integer from 0 to 255, a transparency on top of that of “Color” (0 is opaque, 255 fully transparent). The two opacities multiply. Default value 0
-
“Line Width” : Real, the width of lines, curves and arcs. Default value 0.001
-
“Close” : Boolean, close a line or a curve by joining the last point to the first, or an arc through its centre, and fill it with “Fill Color”. Default value false
-
“Fill Color” : 32 bit integer 0xAARRGGBB, the color that fills a closed line, curve or arc. A fully transparent color, for example 0xFF000000, closes it without filling. Default value 0x000000 (opaque black)
-
“Fill Transparancy” : Integer from 0 to 255, a transparency on top of that of “Fill Color”. Default value 0
-
“Size” : Real, the height of a text. Default value 0.05
-
“Alignment” : String, “l”, “c” or “r”: the point of a text is its left end, its middle or its right end. Default value “l”
-
“Angle” : Real, a text is turned by “Angle” (radians, counterclockwise) about its point. Default value 0
-
“Font” : String, the PostScript name of the font of a text, see text. Default value “TimesNewRomanPSMT”
-
“Pixelated” : Boolean, draw a bitmap with sharp square pixels instead of smoothing between the pixels when it is enlarged. Default value false for a bitmap of pixels, true for a bitmap made by a ColorFunction
-
“Layer” : Integer or a list of integers, the layer to add to. 0 is pl itself, 1 the first layer added to it, 2 the second, and -1 the last one, -2 the one before. A list {n1, n2, …} adds to layer n2 of layer n1, and so on. The panels of a grid of panels made by Graphics.Plot are its layers 1, 2, … Default value 0
-
“alpha”, “Fill alpha” : Integers from 0 to 255, an opacity (255 opaque, 0 fully transparent), the older form of “Transparancy” and “Fill Transparancy”. Default value 255
Output
-
pl2 : a new Graphics object, pl with the elements added. pl.Add returns nothing.
Within one Graphics object the bitmaps are drawn first, then the lines, the curves, the arcs and the texts, each in the order in which they were added. The layers are drawn after that, so a bitmap that should lie on top of a line is put in a layer. A grey background below other bitmaps is a bitmap of one pixel, {“BitMap”, {0,0}, {1,1}, { {224} }}, added first.
Example
A line, a filled triangle, a curve, a circle, a quarter of a disc, a bitmap, two texts and a layer on an A4 page.
Input
- Example.Quanty
-- an empty page, A4 in landscape; a point {x, y} is a fraction of the width and the height of the page
pl = Graphics.New()

-- a line through three points, 0.004 wide, blue
pl.Add({ {0.05,0.55}, {0.15,0.9}, {0.25,0.55} }, {{"Line Width",0.004}, {"Color",0x0000C0}})

-- a closed triangle, filled with a half transparent red
pl.Add({ {0.3,0.55}, {0.4,0.9}, {0.5,0.55} }, {{"Close",true}, {"Fill Color",0x80FF0000}})

-- a curve of two pieces; each point is {xL,yL, x,y, xR,yR}, with the control points before and after it
pl.Add({ {0.55,0.55, 0.55,0.55, 0.55,0.9},
         {0.65,0.9,  0.75,0.9,  0.85,0.9},
         {0.95,0.55, 0.95,0.55, 0.95,0.55} }, {{"Line Width",0.004}, {"Color",0x00A000}})

-- a circle, and a quarter of a disc from 0 to 90 degrees, closed through its centre and filled
pl.Add({"Arc", {0.15,0.25}, 0.1})
pl.Add({"Arc", {0.3,0.2}, 0.1, 0, Pi/2}, {{"Close",true}, {"Fill Color",0xFF8000}})

-- a bitmap of 3 by 2 pixels, the first row at the top, drawn with sharp pixels
pl.Add({"BitMap", {0.45,0.1}, {0.6,0.35}, { {{255,0,0}, {0,160,0}, {0,0,255}},
                                            {0, 128, 255} }}, {{"Pixelated",true}})

-- texts: centred, and turned by 90 degrees
pl.Add("Graphics.Add", 0.5, 0.45, {{"Size",0.06}, {"Alignment","c"}})
pl.Add("turned", 0.68, 0.1, {{"Angle",Pi/2}, {"Color",0x0000C0}})

-- a layer: a small page of its own, 60 mm by 50 mm with its lower left corner at (220 mm, 15 mm)
Inset = Graphics.New({{"Canvas.Size.X",60}, {"Canvas.Size.Y",50}, {"Canvas.Origin.X",220}, {"Canvas.Origin.Y",15}})
Inset.Add({ {0,0}, {1,0}, {1,1}, {0,1} }, {{"Close",true}, {"Fill Color",0xE0E0E0}})
pl.Add(Inset)
-- the option Layer adds to layer 1, so (0.5, 0.5) is the middle of the inset
pl.Add("inset", 0.5, 0.5, {{"Layer",1}, {"Alignment","c"}, {"Size",0.15}})

print("lines", pl.NLine, "curves", pl.NCurve, "arcs", pl.NArc, "texts", pl.NText, "bitmaps", pl.NBitMap, "layers", pl.NLayer)

-- the function form returns a new Graphics object and leaves pl as it is
pl2 = Graphics.Add(pl, "a third text", 0.05, 0.02)
print("texts", pl.NText, pl2.NText)

file = io.open("Add.svg", "w")
file:write(Graphics.ToSVG(pl, {{"RelativeSize",true}}))
file:close()
Result
lines	2	curves	1	arcs	2	texts	2	bitmaps	1	layers	2
texts	2	3
The script writes Add.svg. The text “inset” is in the layer, so it is not counted among the texts of pl; pl.NLayer counts pl itself and its one layer. The circle is round although the page is not square, because its radius is a fraction of $\sqrt{\mathrm{width} \cdot \mathrm{height}}$.
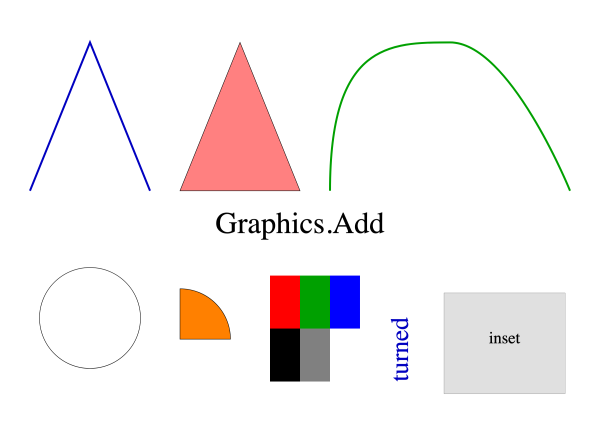
Table of contents
-
