Graphics
A Graphics object is a page with lines, curves, dots, texts and bitmaps on it. It is made by one of the plot functions, for example Graphics.Plot() for spectra and response functions or Graphics.PlotBands() for band structures, or as an empty page by Graphics.New(). Graphics.ToSVG(pl) and Graphics.ToPS(pl) turn a Graphics object into the text of an svg or an encapsulated PostScript file. An svg file can be opened in any web browser and in drawing programs such as Inkscape; a PostScript file can be included in LaTeX or turned into a pdf.
The page
A Graphics object has a size in mm, pl.SizeX by pl.SizeY. Standardly the plots of Graphics.Plot are an A4 page in landscape, 297 mm by 210 mm. Everything on the page is given relative to it: a point is a fraction of the width and of the height of the page, with (0,0) the lower left and (1,1) the upper right corner, and the width of a line and the height of a text are fractions of $\sqrt{\mathrm{width} \cdot \mathrm{height}}$. A page of another size therefore gives the same plot, larger or smaller, and a page of another shape the same plot stretched.
A Graphics object can hold other Graphics objects as layers. G1 + G2 is a new Graphics object, G1 with G2 as a layer on top of it. Each layer has its own size and position on the page, G.SizeX, G.SizeY and G.OriginX, G.OriginY (its lower left corner), all in mm, so a plot can be put on another plot as an inset, or several plots side by side. The layers are drawn in the order in which they were added, each on top of the ones before. Within one layer the bitmaps are drawn first, then the lines, the curves, the dots and the texts.
Colors
A color is a 32 bit integer 0xAARRGGBB: the transparency AA and the red, green and blue RR, GG and BB, each two hexadecimal digits from 00 to FF. AA = 00 is opaque and AA = FF fully transparent, so a color written 0xRRGGBB is opaque: 0xFF0000 is red, 0x00A000 green, 0x0000FF blue, 0x000000 black and 0x80FF0000 a half transparent red. All functions of Graphics use this form. PostScript files do not handle transparency correctly; use svg files for plots with transparent colors.
Text
Texts are written in the font given by its PostScript name, by default “TimesNewRomanPSMT”; others are for example “ArialMT” and “CourierNewPSMT”. PostScript files use the font; many svg viewers do not know these names and use a font of their own. Letters outside ASCII, such as Greek letters, are written correctly in svg files but not in PostScript files; write “Delta” or “omega” in a text meant for both.
Example
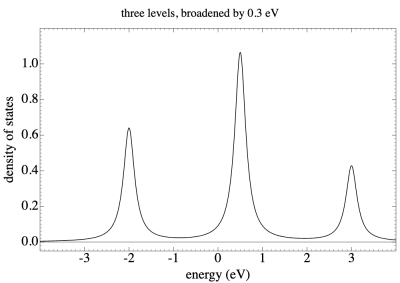
The density of states of three levels, with a title above the frame, written as an svg and a PostScript file.
Input
- Example.Quanty
-- the density of states of three levels, at -2, 0.5 and 3 eV with weights 0.3, 0.5 and 0.2
G = ResponseFunction.New({ {0, -2, 0.5, 3}, {0.3, 0.5, 0.2}, mu = 0, type = "ListOfPoles" })

-- a plot of -Im G / pi, broadened by a Lorentzian of 0.3 eV (full width at half maximum), at 801 energies
pl = Graphics.Plot(G/Pi, 0.3, 0, 801, {{"plotRe",false}, {"Negate",true},
                   {"Frame",{{"Xmin",-4}, {"Xmax",4}, {"Ymin",-0.05}, {"Ymax",1.2}, {"FirstYTick",0}, {"dYTick",0.2}, {"YFormat","%.1f"},
                             {"XLabel","energy (eV)"}, {"YLabel","density of states"}, {"XLMargin",0.1}, {"YRMargin",0.1}, {"YAxis",-10}}}})

-- a title above the frame; the point (0.5, 0.94) is a fraction of the width and the height of the page
pl.Add("three levels, broadened by 0.3 eV", 0.5, 0.94, {{"Size",0.035}, {"Alignment","c"}})

print(string.format("The page is %.1f mm wide and %.1f mm high", pl.SizeX, pl.SizeY))

-- the plot as an svg file, for a web browser, and as an encapsulated PostScript file
file = io.open("DOS.svg", "w")
file:write(Graphics.ToSVG(pl, {{"RelativeSize",true}}))
file:close()
file = io.open("DOS.ps", "w")
file:write(Graphics.ToPS(pl))
file:close()
Result
The page is 297.3 mm wide and 210.2 mm high
The script writes DOS.svg and DOS.ps. With the option “RelativeSize” the svg file fills the window it is shown in, for example that of a web browser.